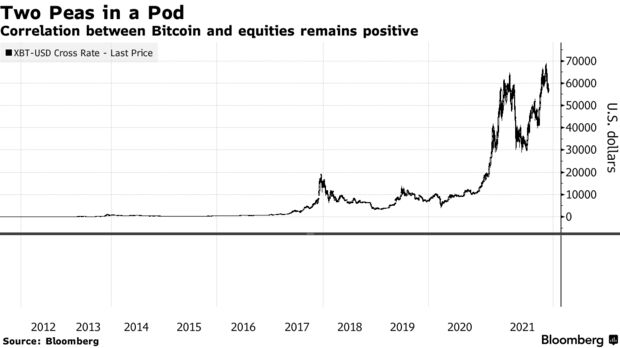
On Friday, stocks rose then sunk as traders digested the latest U.S. employment data. Bitcoin followed suit, posting nearly the exact same moves.
The world’s largest digital currency dropped as much as 3.4% during the session to trade around $54,960, which is roughly 20% off its recent record highs. U.S. stocks also fell, with the S&P 500 Index losing 1.1% as of 1:10 p.m. in New York.
It’s not unusual to see Bitcoin and the stock market trade in tandem in recent weeks. In fact, the 100-day correlation coefficient of Bitcoin and the S&P 500 stands at 0.33, among the highest such readings this year. Bitcoin has long been championed by advocates as an asset uncorrelated from traditional financial markets.
A coefficient of 1 means the assets are moving in lockstep, while minus-1 would show they’re moving in opposite directions.

“The crypto industry looks at Bitcoin as like this super-low-risk option. And it looks at some of the other coins as the higher risk option. But take a step back, and the rest of us look at Bitcoin as a high-risk option in the broader investment landscape,” said Liz Young, head of investment strategy at SoFi. “So it’s all about your perspective and your comfort level.”
Bitcoin’s having a rough week and is on pace to post its fourth straight day lower. Many traders have turned to technical indicators for suggestions on its next potential move. Right now, Bitcoin is testing its average price over the last 100 days, while Ether, the second-largest digital asset, is testing its 50-day moving average. Breaking below those key levels could mean more pain ahead for investors.

Still, despite some recent rough patches, Bitcoin is still up about 100% for the year. And crypto bulls remain emboldened, putting out predictions that Bitcoin — and other coins — could still rally strongly into year-end.
Messari CEO and co-founder Ryan Selkis is out with a new report about what he expects for 2022 — in it, he writes that there are certain fundamental analyses traders could follow to get a read on Bitcoin’s next possible moves.
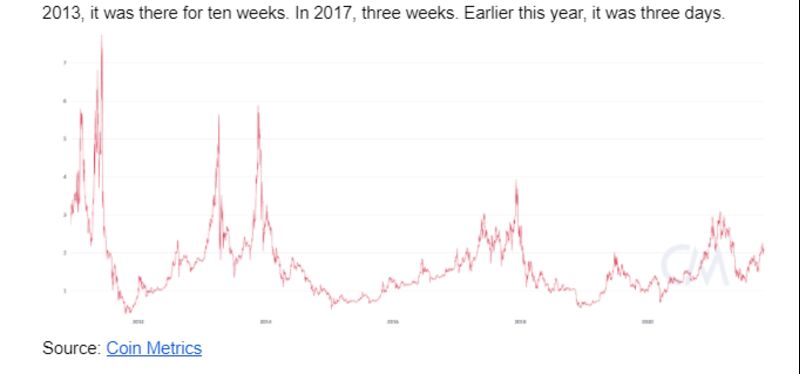
One is something called the market-value to realized-value metric (or MVRV), which represents the ratio of free-float Bitcoin market cap to the realized value, which sums the market value of each coin according to the time it last moved on the blockchain. The gauge shows that the market cap can stay the same while the realized metric spikes — and vice versa.

When the metric falls below 1, Selkis jokingly says to “sell a kidney or a newborn to buy.”
“If history were to repeat itself, what’s that mean in dollar terms? Hitting a MVRV of 3 again this year would take us to the $100,000-125,000 range. Not bad!,” Selkis wrote. “The king has no real rival.”
-Read original story on Bloomberg


